See also

 02.10.2024 07:22 AM
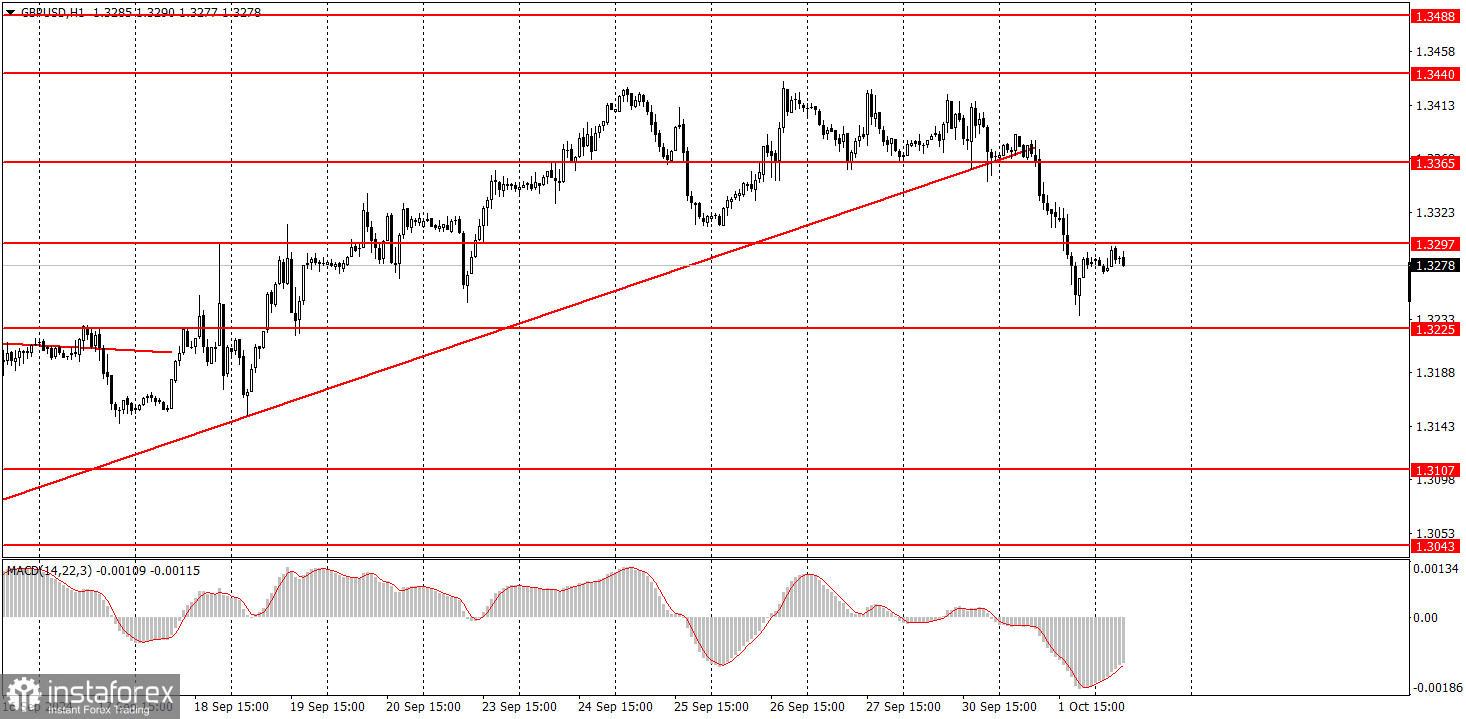
On Tuesday, the GBP/USD pair also showed a significant downward movement and, most importantly, broke through the ascending trend line. The British pound may begin a downward trend for the first time in a long while. It's hard to predict how long the pair's decline will last, but it was clear that the dollar couldn't keep falling indefinitely without correction. The JOLTs report on job openings in the US exceeded expectations, but at the same time, the equally important ISM business activity index was only 47.2 points, which was below forecasts. Therefore, we can't attribute the dollar's rise to macroeconomic data—primarily since no crucial reports were published in the UK, and the decline started well before the release of the US reports. Of course, by the end of the week, the dollar could fall more than it rose on Monday and Tuesday. If the Nonfarm Payrolls and unemployment reports disappoint, the US currency could plunge again, despite Powell's assurances that there is no need for a 0.5% rate cut in November.
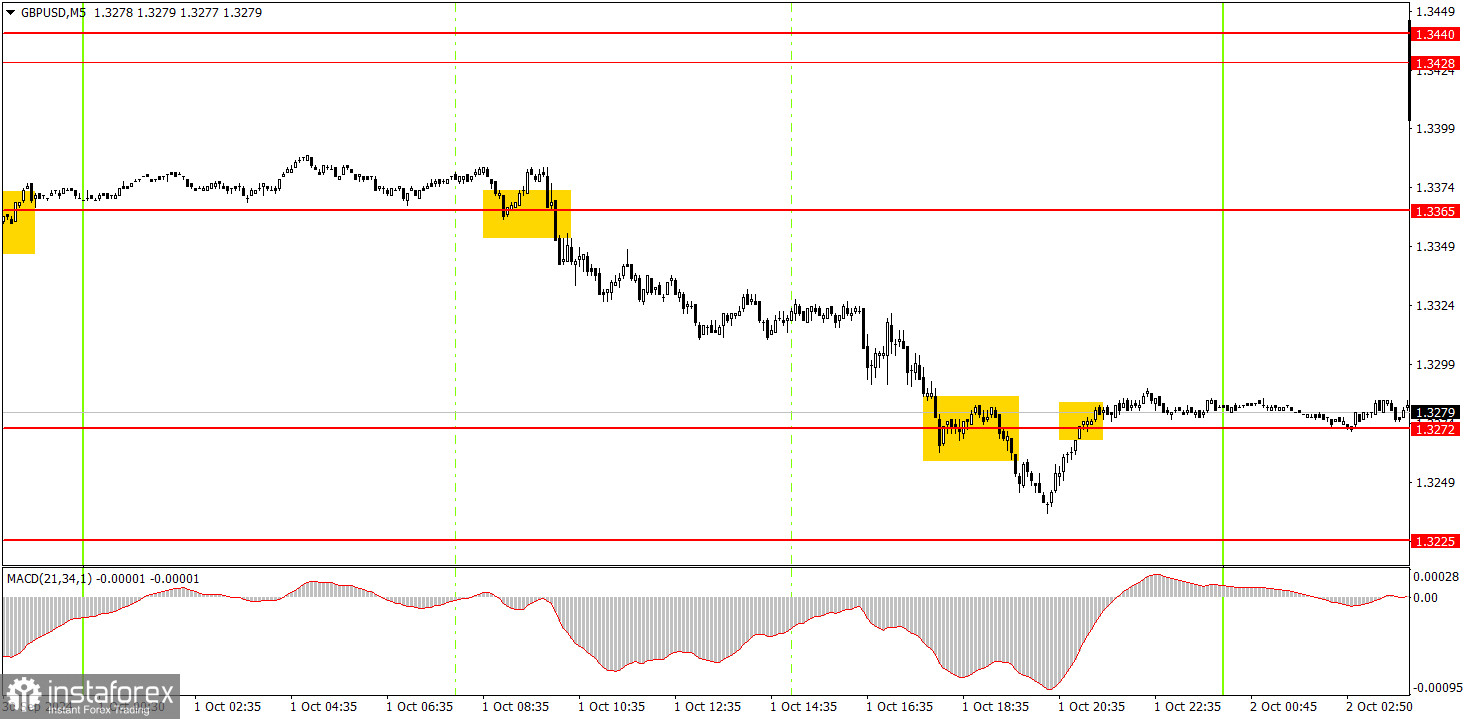
In the 5-minute time frame on Tuesday, the price formed one very good signal. At the start of the European trading session, the price broke through the 1.3365 level, triggering a drop below the 1.3272 level. Unfortunately, before breaking through 1.3365, the price rebounded, but the profit from the short position significantly outweighed the loss from the long position.
The GBP/USD pair has broken the upward trend in the hourly time frame. Currently, there are no issues with volatility, meaning that traders can open trades each day rather than just watching small price movements, which could be described as "convulsions." The US dollar has begun its long-awaited rise, but the two-day drop in the pair doesn't guarantee the formation of a full-fledged downtrend that we are expecting. Therefore, caution is advised when selling, especially given the solid macroeconomic backdrop scheduled for the rest of the week.
On Wednesday, the pound may continue its downward movement, and trading should be based on the 1.3272 level. Breaking this level will open the way for further decline.
On the 5-minute timeframe, trades can be made at the following levels: 1.2913, 1.2980-1.2993, 1.3043, 1.3102-1.3107, 1.3145-1.3167, 1.3225, 1.3272, 1.3365, 1.3428-1.3440, 1.3488, 1.3537. No significant events are scheduled in the UK on Wednesday, while in the US, only the ADP report, considered the "little brother" of NonFarm Payrolls, will be released. A strong reaction to this report is not expected, but a weak result could temporarily halt the dollar's rise.
Support and Resistance Price Levels: These levels serve as targets when opening buy or sell positions. They can also be used as points to set Take Profit levels.
Red Lines: These represent channels or trend lines that display the current trend and indicate the preferred trading direction.
MACD Indicator (14,22,3): The histogram and signal line serve as an auxiliary indicator that can also be used as a source of trading signals.
Important Speeches and Reports (always found in the news calendar) can significantly impact the movement of a currency pair. Therefore, trading should be done with maximum caution during their release, or you may choose to exit the market to avoid a sharp price reversal against the preceding movement.
For Beginners Trading on the Forex Market: It's essential to remember that not every trade will be profitable. Developing a clear strategy and practicing money management is key to achieving long-term success in trading.
You have already liked this post today
*The market analysis posted here is meant to increase your awareness, but not to give instructions to make a trade.


