See also


 28.08.2023 04:51 PM
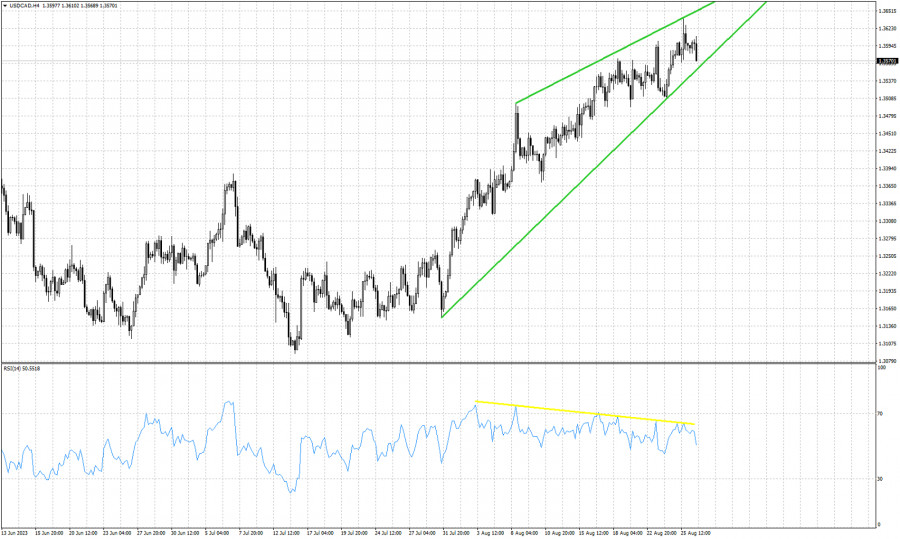
Green lines- wedge pattern
Yellow line- bearish RSI divergence
USDCAD is trading around 1.3574 after making a new higher high last week around 1.3638. As we mentioned in our previous posts, we continue to believe that the upside potential is limited. Price technically remains in a bullish trend, but the RSI is not making higher highs. Instead the RSI is providing bearish divergence signals. The bearish divergence signals are not bearish reversal signs. They are warnings of a weakening up trend. Support is found at 1.3555 and at 1.3508. The week has started with price under pressure and bulls need to be cautious. There are increased chances that price breaks out and below the wedge pattern. This would be a bearish signal. As last week, we remain neutral if not bearish USDCAD.
You have already liked this post today
*The market analysis posted here is meant to increase your awareness, but not to give instructions to make a trade.
During the European session, the euro reached a new high around +2/8 Murray, located at 1.1473. This movement in EUR/USD occurred after the announcement by China's Ministry of Finance that
Early in the American session, gold is undergoing a strong technical correction after reaching a new high around 3,237.69 for now. Economic data from the United States will be released
Useful links: My other articles are available in this section InstaForex course for beginners Popular Analytics Open trading account Important: The begginers in forex trading need to be very careful
The Eagle indicator is reaching oversold levels and is giving a negative signal, so we will look for opportunities to sell below 3,145 or below 3,131 with a target
 Our new app for your convenient and fast verification
Forex Chart
Web-version

Your IP address shows that you are currently located in the USA. If you are a resident of the United States, you are prohibited from using the services of InstaFintech Group including online trading, online transfers, deposit/withdrawal of funds, etc.
If you think you are seeing this message by mistake and your location is not the US, kindly proceed to the website. Otherwise, you must leave the website in order to comply with government restrictions.
Why does your IP address show your location as the USA?
Please confirm whether you are a US resident or not by clicking the relevant button below. If you choose the wrong option, being a US resident, you will not be able to open an account with InstaTrade anyway.
We are sorry for any inconvenience caused by this message.

