See also

 18.08.2023 05:59 AM
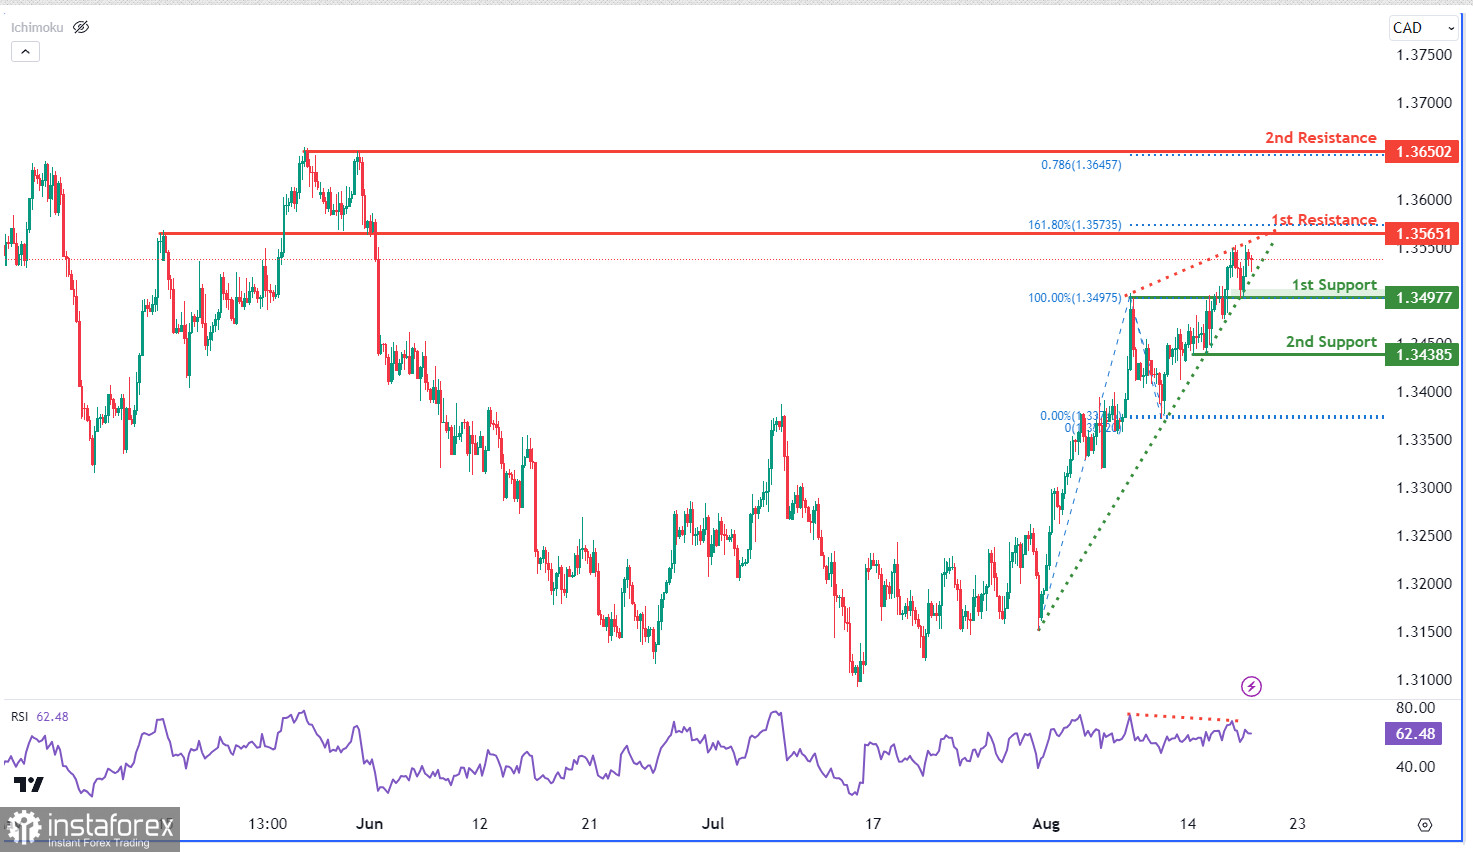
The USD/CAD chart displays a bearish trend, reinforced by an RSI indicator showing bearish divergence with the price. The price might descend towards the 1st support at 1.3498 and the 2nd support at 1.3387, both being overlap supports. Conversely, the 1st resistance at 1.3565 aligns with the 161.80% Fibonacci extension, and the 2nd resistance at 1.3650 matches the 78.60% Fibonacci projection, indicating as a multi-swing high resistance.
Separately, a rising wedge is a reversal indicator often seen in bear markets. This pattern appears when prices rise with converging pivot highs and lows towards an apex. If paired with diminishing volume, it can hint at a bear market continuation.
You have already liked this post today
*The market analysis posted here is meant to increase your awareness, but not to give instructions to make a trade.


