See also


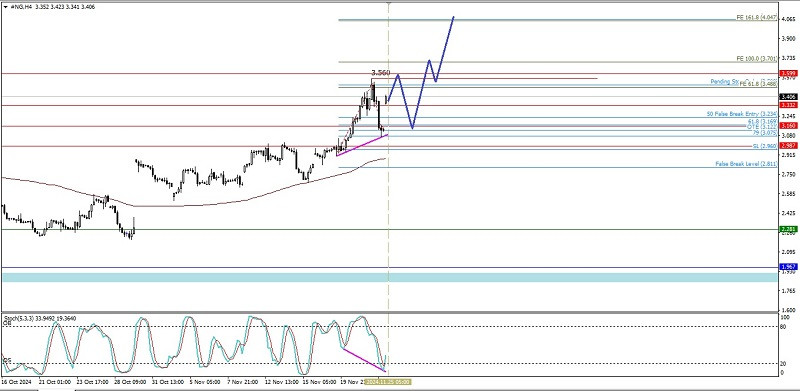
From what we can see on the 4-hour chart, the Natural Gas commodity asset appears to be moving above the MA (100) which has a steep slope and is supported by confirmation of the apperance of hidden deviations between the #NG price movement and the Stochastic Oscillator indicator, indicating that in the near future the 3.560 level will be tested and after this level is tested, #NG has the potential to be corrected to weaken down to the 3.169 level and as long as the downward correction does not broken and close below the 2.960 level, #NG still has the potential to strengthen up to the 3.701 and 4.047 levels as the next targets if momentum and volatility support.
(Disclaimer)
You have already liked this post today
*The market analysis posted here is meant to increase your awareness, but not to give instructions to make a trade.


