See also

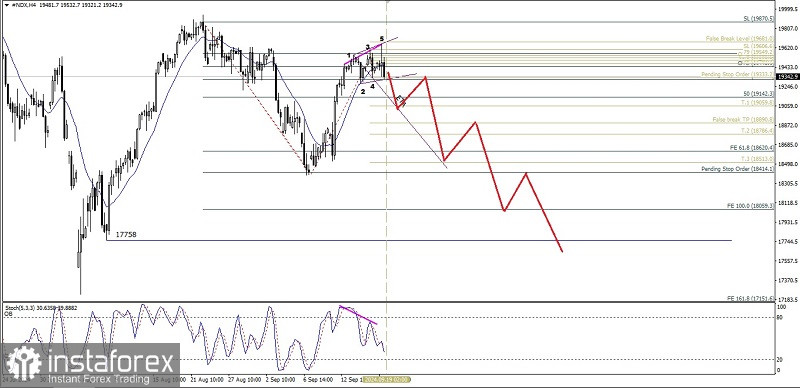
On the 4-hour chart, the Nasdaq 100 index appears to have a deviation between the price movement of the index and the Stochastic Oscillator indicator and the appearance of the Bearish Wolf Waves pattern so that in the near future #NDX has the potential to weaken down towards the ETA Line of the Wolf Waves where the level of 19342.9 will be tested in the near future if it turns out to be successfully penetrated downwards and as long as there is no significant strengthening that breaks above the level of 19870.5, #NDX will continue to weaken again to the level of 18620.4 and if the momentum and volatility support it, #NDX has the potential to go to the level of 17758.0.
(Disclaimer)
You have already liked this post today
*The market analysis posted here is meant to increase your awareness, but not to give instructions to make a trade.


