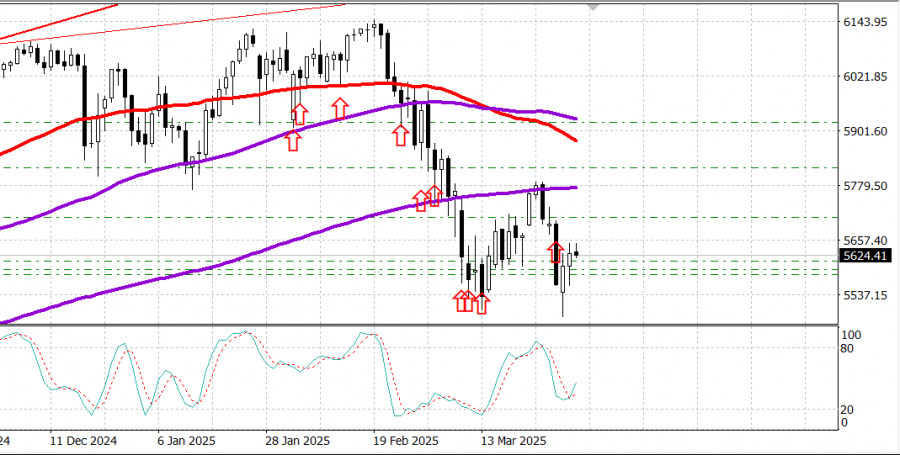
#FTSE (FTSE 100). Exchange rate and online charts.
Currency converter
03 Apr 2025 06:14
(0.01%)
Closing price, the previous day.
Opening price.
The highest price over the last trading day.
The lowest price over the last trading day
Price range high in the last week
Price range low in the last week
The FTSE 100 Index is a share index of the 100 companies listed on the London Stock Exchange with the largest market capitalization. The index was launched in 1984. FTSE stands for Financial Times Stock Exchange. The FTSE 100 is seen as an indicator of the strength of the UK economy and is on the most important indices in Europe. The FTSE 100 companies make up about 80% of the UK stock market.
Since its inception in 1984, most companies that formed the FTSE 100 have been removed from it. Members in the list of FTSE 100 are revised every quarter based on their performance and change in overall market capital.
About 60% of FTSE 100 companies' revenues come from sales made outside the UK. Interestingly, most companies listed in the index provide their earnings reports in US dollars. So, the FTSE 100 is one of the major world indices, thus sensitive to global events.
Thanks to its structure, oil and mining companies prevail in the FTSE 100, thus representing over 30% of the index.
To trade the FTSE 100 successfully, you should learn about the companies that comprise it. It is important to stress that the FTSE 100 is a market-capitalization weighted index covering a broad range of industries.
See Also
- Technical analysis
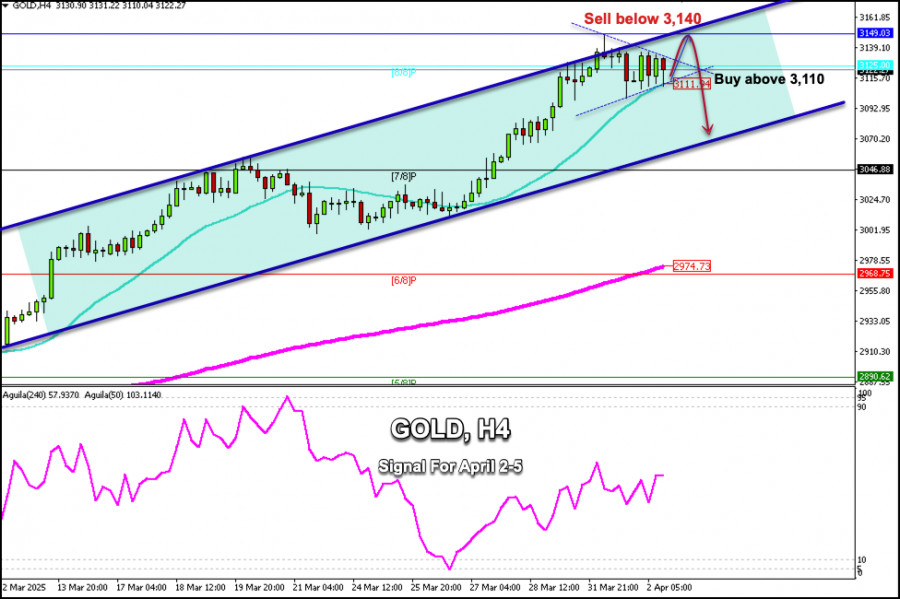
Trading Signals for GOLD (XAU/USD) for April 2-5, 2025: sell below $3,140 or buy above $3,110 (21 SMA - symmetrical triangle)
The symmetrical triangle pattern observed on the H4 chart shows that gold could experience a strong bullish impulse to reach 3,169, where resistance R_1 is located. Below this area, a technical correction could occur.Author: Dimitrios Zappas
15:15 2025-04-02 UTC+2
988
XAU/USD. Analysis and ForecastAuthor: Irina Yanina
13:22 2025-04-02 UTC+2
958
Today, the AUD/USD pair is showing positive momentum, rebounding from nearly a four-week low.Author: Irina Yanina
12:25 2025-04-02 UTC+2
913
- Today the USD/CAD pair is attempting to halt yesterday's decline, trying to hold above the 1.4300 level.
Author: Irina Yanina
12:22 2025-04-02 UTC+2
898
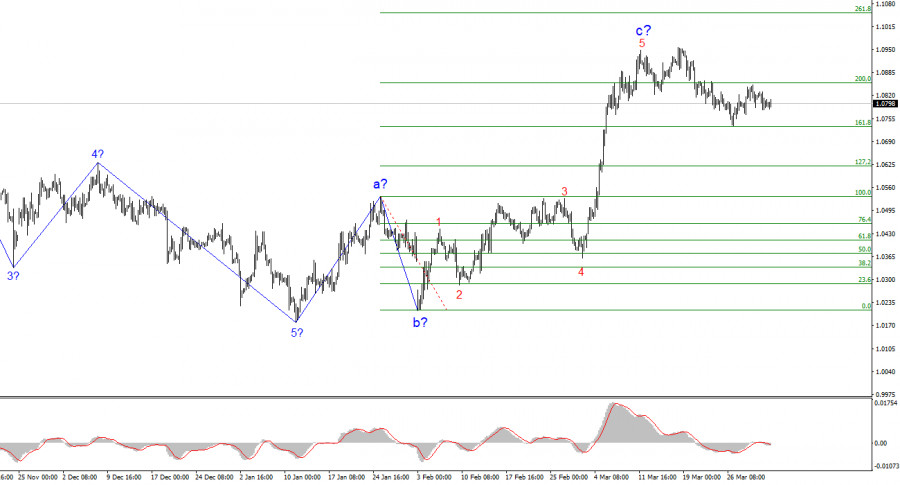
EUR/USD has barely moved over Monday, Tuesday, and WednesdayAuthor: Chin Zhao
20:25 2025-04-02 UTC+2
808
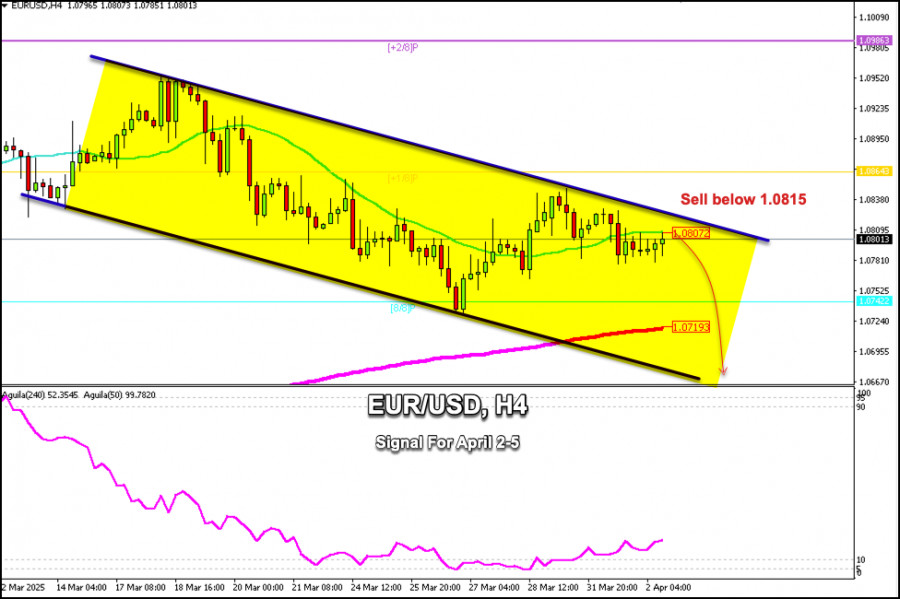
Technical analysisTrading Signals for EUR/USD for April 2-5, 2025: sell below 1.0815 (21 SMA - +1/8 Murray)
If the euro breaks and consolidates above the bearish trend channel, we could expect it to reach +1/8 Murray level at 1.0864 in the coming days. EUR/USD could even reach +2/8 Murray level located at 1.0986.Author: Dimitrios Zappas
15:18 2025-04-02 UTC+2
808
- Market overview on April 2
Author: Jozef Kovach
12:15 2025-04-02 UTC+2
793
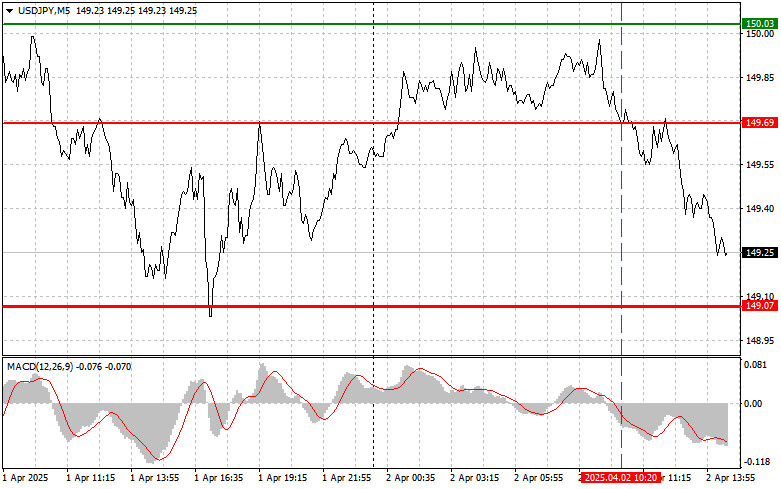
USD/JPY: Simple Trading Tips for Beginner Traders on April 2nd (U.S. Session)Author: Jakub Novak
20:14 2025-04-02 UTC+2
793
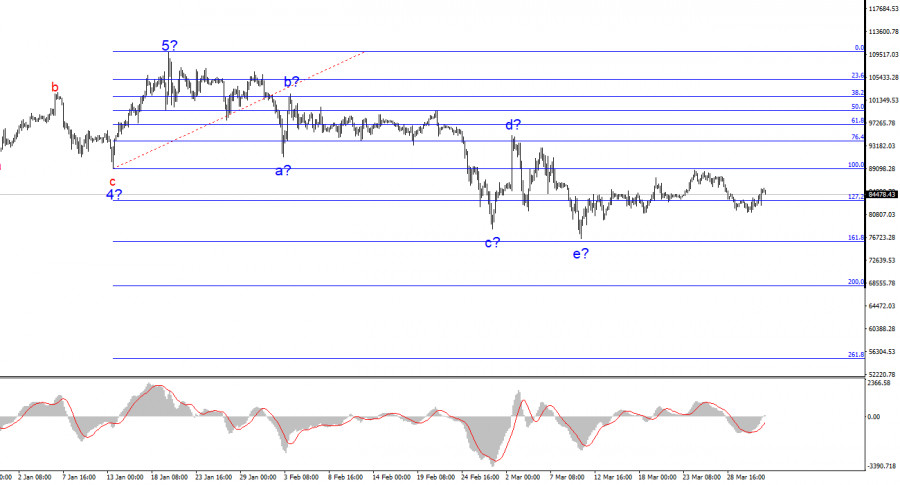
The BTC/USD pair managed to halt its decline, and the current wave structure suggests a potential rise in the world's leading cryptocurrency.Author: Chin Zhao
12:17 2025-04-02 UTC+2
748
- Technical analysis
Trading Signals for GOLD (XAU/USD) for April 2-5, 2025: sell below $3,140 or buy above $3,110 (21 SMA - symmetrical triangle)
The symmetrical triangle pattern observed on the H4 chart shows that gold could experience a strong bullish impulse to reach 3,169, where resistance R_1 is located. Below this area, a technical correction could occur.Author: Dimitrios Zappas
15:15 2025-04-02 UTC+2
988
- XAU/USD. Analysis and Forecast
Author: Irina Yanina
13:22 2025-04-02 UTC+2
958
- Today, the AUD/USD pair is showing positive momentum, rebounding from nearly a four-week low.
Author: Irina Yanina
12:25 2025-04-02 UTC+2
913
- Today the USD/CAD pair is attempting to halt yesterday's decline, trying to hold above the 1.4300 level.
Author: Irina Yanina
12:22 2025-04-02 UTC+2
898
- EUR/USD has barely moved over Monday, Tuesday, and Wednesday
Author: Chin Zhao
20:25 2025-04-02 UTC+2
808
- Technical analysis
Trading Signals for EUR/USD for April 2-5, 2025: sell below 1.0815 (21 SMA - +1/8 Murray)
If the euro breaks and consolidates above the bearish trend channel, we could expect it to reach +1/8 Murray level at 1.0864 in the coming days. EUR/USD could even reach +2/8 Murray level located at 1.0986.Author: Dimitrios Zappas
15:18 2025-04-02 UTC+2
808
- USD/JPY: Simple Trading Tips for Beginner Traders on April 2nd (U.S. Session)
Author: Jakub Novak
20:14 2025-04-02 UTC+2
793
- The BTC/USD pair managed to halt its decline, and the current wave structure suggests a potential rise in the world's leading cryptocurrency.
Author: Chin Zhao
12:17 2025-04-02 UTC+2
748


