অ্যাকচুয়াল প্যাটার্নস

প্যাটার্ন হলো গ্রাফিক্যাল মডেল, যা মূল্য ওঠানামার ভিত্তিতে চার্টে তৈরি হয়। টেকনিক্যাল বিশ্লেষণের নীতি অনুযায়ী, ইতিহাসের (প্রাইস মুভমেন্ট) পুনরাবৃত্তি ঘটে। অর্থাৎ, পরিস্থিতি যদি একই রকম থাকে তাহলে প্রাইস মুভমেন্টও প্রায় একই রকম হয়। এর ফলে মূল্যের ওঠানামা কেমন হবে তা আগেই থেকেই অনুমান করা যায়।
ইন্সটাফরেক্স এর প্রাসঙ্গিক প্যাটার্নসমূহ সহজেই ব্যবহার করা যায়, যার মাধ্যমে মার্কেটের সর্বশেষ পরিস্থিতি জানা যায় এবং তার উপর ভিত্তি করে সিদ্ধান্ত নেওয়া যায়। আমাদের সেবাগুলো থেকে আপনি যেকোনো পেয়ার এবং টাইমফ্রেমের জন্য সর্বশেষ এবং সবচেয়ে প্রাসঙ্গিক প্যাটার্নগুলো খুঁজে পাবেন।
Triple Bottom
was formed on 02.04 at 20:40:09 (UTC+0)
signal strength 1 of 5
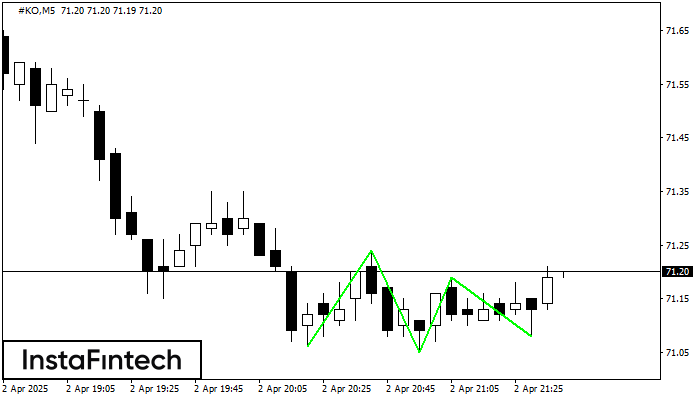
The Triple Bottom pattern has formed on the chart of #KO M5. Features of the pattern: The lower line of the pattern has coordinates 71.24 with the upper limit 71.24/71.19, the projection of the width is 18 points. The formation of the Triple Bottom pattern most likely indicates a change in the trend from downward to upward. This means that in the event of a breakdown of the resistance level 71.06, the price is most likely to continue the upward movement.
The M5 and M15 time frames may have more false entry points.
- All
- All
- Bearish Rectangle
- Bearish Symmetrical Triangle
- Bearish Symmetrical Triangle
- Bullish Rectangle
- Double Top
- Double Top
- Triple Bottom
- Triple Bottom
- Triple Top
- Triple Top
- All
- All
- Buy
- Sale
- All
- 1
- 2
- 3
- 4
- 5
Đảo đầu và vai
was formed on 22.04 at 04:21:51 (UTC+0)
signal strength 1 of 5
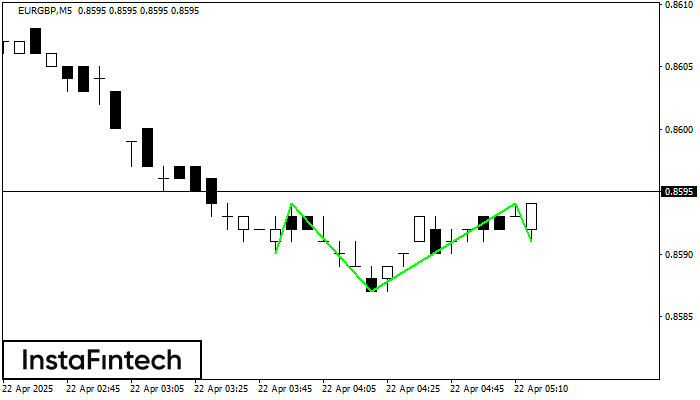
Theo M5, EURGBP đang định hình mô hình kỹ thuật - Đảo đầu và vai. Trong trường hợp Đường viền cổ 0.8594/0.8594 bị phá vỡ, công
Khung thời gian M5 và M15 có thể có nhiều điểm vào lệnh sai hơn.
Open chart in a new window
Đáy đôi
was formed on 22.04 at 03:50:50 (UTC+0)
signal strength 1 of 5
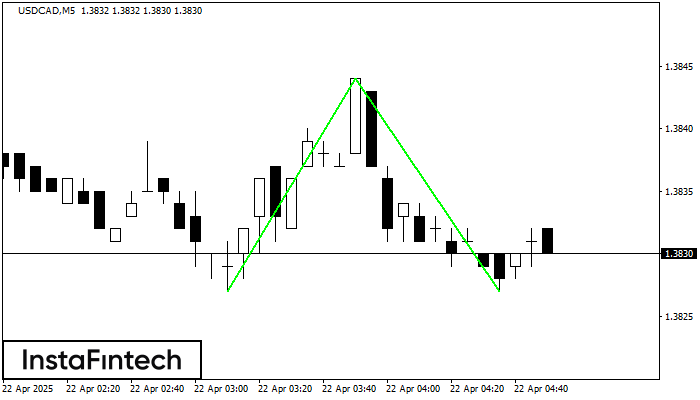
Mô hình Đáy đôi đã được hình thành trên USDCAD M5. Sự hình thành này báo hiệu sự đảo chiều của xu hướng từ dưới lên trên. Tín hiệu
Khung thời gian M5 và M15 có thể có nhiều điểm vào lệnh sai hơn.
Open chart in a new window
Đỉnh ba
was formed on 22.04 at 02:00:16 (UTC+0)
signal strength 3 of 5

Mô hình Đỉnh ba đã được hình thành trên biểu đồ của công cụ giao dịch EURCAD M30. Đó là mô hình đảo chiều có các đặc điểm
Open chart in a new window