অ্যাকচুয়াল প্যাটার্নস

প্যাটার্ন হলো গ্রাফিক্যাল মডেল, যা মূল্য ওঠানামার ভিত্তিতে চার্টে তৈরি হয়। টেকনিক্যাল বিশ্লেষণের নীতি অনুযায়ী, ইতিহাসের (প্রাইস মুভমেন্ট) পুনরাবৃত্তি ঘটে। অর্থাৎ, পরিস্থিতি যদি একই রকম থাকে তাহলে প্রাইস মুভমেন্টও প্রায় একই রকম হয়। এর ফলে মূল্যের ওঠানামা কেমন হবে তা আগেই থেকেই অনুমান করা যায়।
ইন্সটাফরেক্স এর প্রাসঙ্গিক প্যাটার্নসমূহ সহজেই ব্যবহার করা যায়, যার মাধ্যমে মার্কেটের সর্বশেষ পরিস্থিতি জানা যায় এবং তার উপর ভিত্তি করে সিদ্ধান্ত নেওয়া যায়। আমাদের সেবাগুলো থেকে আপনি যেকোনো পেয়ার এবং টাইমফ্রেমের জন্য সর্বশেষ এবং সবচেয়ে প্রাসঙ্গিক প্যাটার্নগুলো খুঁজে পাবেন।
Double Bottom
was formed on 02.04 at 10:40:27 (UTC+0)
signal strength 1 of 5
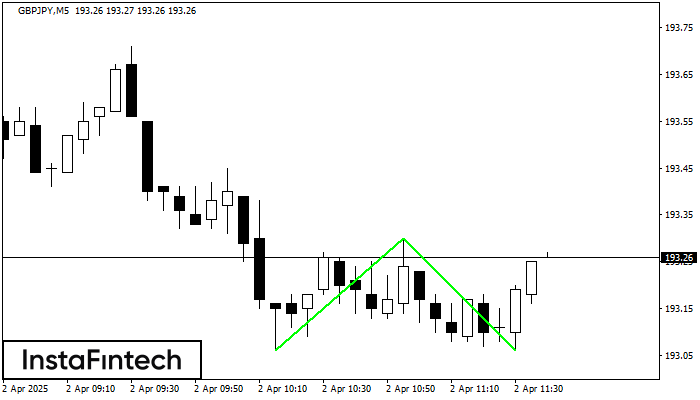
The Double Bottom pattern has been formed on GBPJPY M5; the upper boundary is 193.30; the lower boundary is 193.06. The width of the pattern is 24 points. In case of a break of the upper boundary 193.30, a change in the trend can be predicted where the width of the pattern will coincide with the distance to a possible take profit level.
The M5 and M15 time frames may have more false entry points.
- All
- All
- Bearish Rectangle
- Bearish Symmetrical Triangle
- Bearish Symmetrical Triangle
- Bullish Rectangle
- Double Top
- Double Top
- Triple Bottom
- Triple Bottom
- Triple Top
- Triple Top
- All
- All
- Buy
- Sale
- All
- 1
- 2
- 3
- 4
- 5
Double Top
сформирован 21.04 в 20:31:25 (UTC+0)
сила сигнала 1 из 5
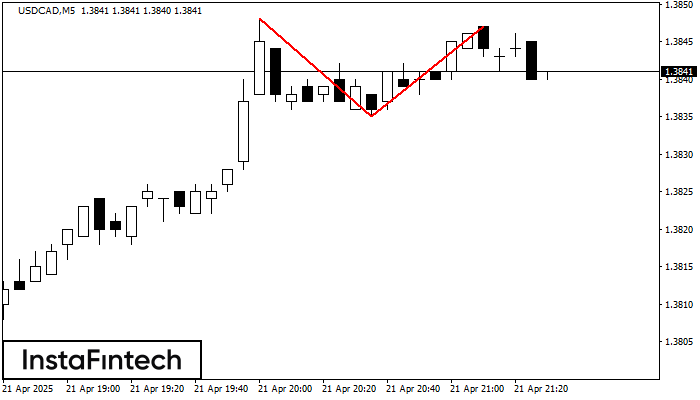
The Double Top pattern has been formed on USDCAD M5. It signals that the trend has been changed from upwards to downwards. Probably, if the base of the pattern 1.3835
The M5 and M15 time frames may have more false entry points.
Открыть график инструмента в новом окне
Double Bottom
сформирован 21.04 в 20:30:22 (UTC+0)
сила сигнала 2 из 5
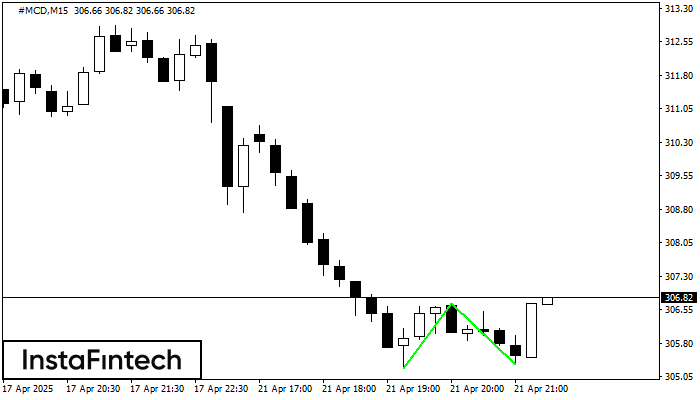
The Double Bottom pattern has been formed on #MCD M15. Characteristics: the support level 305.24; the resistance level 306.70; the width of the pattern 146 points. If the resistance level
The M5 and M15 time frames may have more false entry points.
Открыть график инструмента в новом окне
Double Top
сформирован 21.04 в 20:25:24 (UTC+0)
сила сигнала 1 из 5
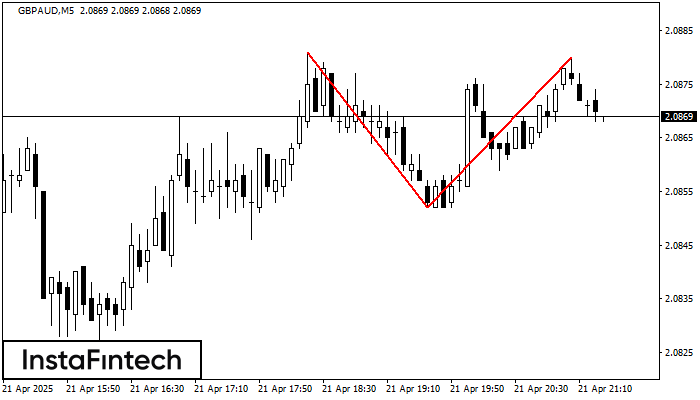
On the chart of GBPAUD M5 the Double Top reversal pattern has been formed. Characteristics: the upper boundary 2.0880; the lower boundary 2.0852; the width of the pattern 28 points
The M5 and M15 time frames may have more false entry points.
Открыть график инструмента в новом окне