আরও দেখুন

 04.10.2024 07:08 AM
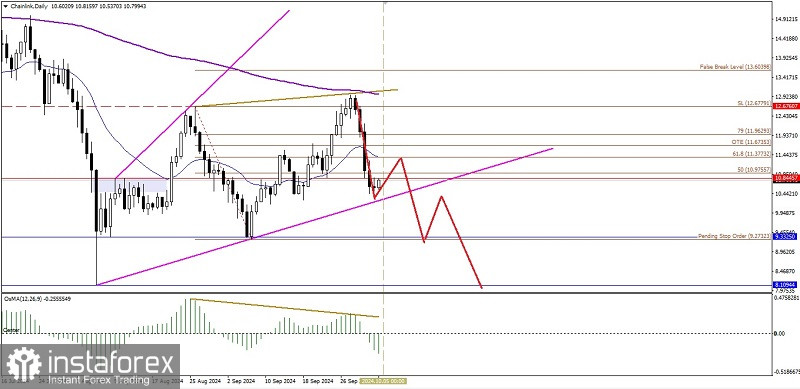
From the daily chart of the Chainlink cryptocurrency, there are several interesting things, first there is an Ascending Broadening Wedge pattern and second there is a deviation between price movements and the MACD Histogram indicator so that based on these two facts it gives an indication that in the next few days Chainlink has the potential to weaken down even though there is a possibility of a correction to strengthen as long as it does not broken and close above the level of 12.24139 Chainlink has the potential to weaken down to the level of 9.27323 as its main target and if the momentum and volatility support it then the level of 8.10944 is the next target to be targeted.
(Disclaimer)
You have already liked this post today
*এখানে পোস্ট করা মার্কেট বিশ্লেষণ আপনার সচেতনতা বৃদ্ধির জন্য প্রদান করা হয়, ট্রেড করার নির্দেশনা প্রদানের জন্য প্রদান করা হয় না।


