আরও দেখুন


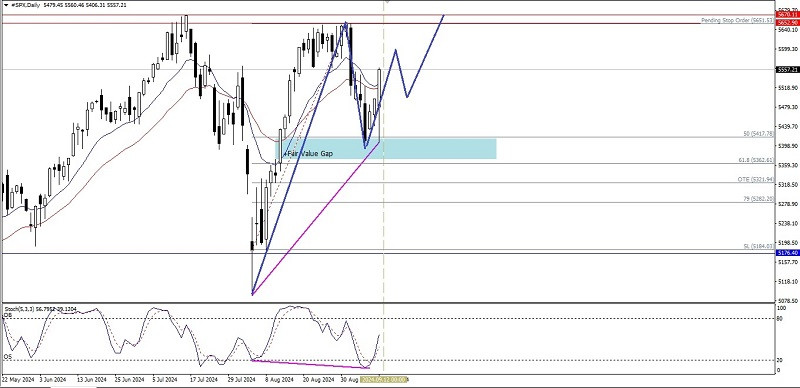
With the appearance of hidden deviations between the price movement of the S&P 500 index which formed a Lower High but the opposite occurred on the Stochastic Oscillator indicator which actually formed a Lower Low plus currently the price movement of #SPX is above EMA 13 & EMA 26 which also coincidentally EMA 13 is positioned above EMA 26 where all this indicates that Buyers still hold control in this index then in the next few days #SPX has the potential to strengthen where the level of 5670.11 will be tested but all of these strengthening scenarios will be invalid and canceled by themselves if on its way to the target level there is suddenly a weakening correction that breaks below 5282.20.
(Disclaimer)
You have already liked this post today
*এখানে পোস্ট করা মার্কেট বিশ্লেষণ আপনার সচেতনতা বৃদ্ধির জন্য প্রদান করা হয়, ট্রেড করার নির্দেশনা প্রদানের জন্য প্রদান করা হয় না।


