النماذج الفعلية

النماذج هي نماذج رسومية تتشكل في الرسم البياني حسب السعر. وفقا لأحد المسلمات التحليلية الفنية، فإن التاريخ (حركة السعر) يكرر نفسه. ويعني ذلك أن حركات الأسعار غالباً ما تكون متشابهة في نفس الأوضاع مما يجعل من الممكن التنبؤ بزيادة تطوير الوضع الذي يتسم باحتمال كبير.
النماذج ذات الصلة المقدمة من قبل إنستافوركس هي خدمة سهلة الاستخدام تسمح لك بمعرفة التغييرات الأخيرة في السوق والرد على الأدلة من السوق في الوقت المناسب. في خدمتنا، ستجد دائمًا النماذج الأكثر حداثة وملاءمة في أي زوج وأي إطار زمني.
Triple Top
was formed on 03.04 at 16:19:38 (UTC+0)
signal strength 1 of 5
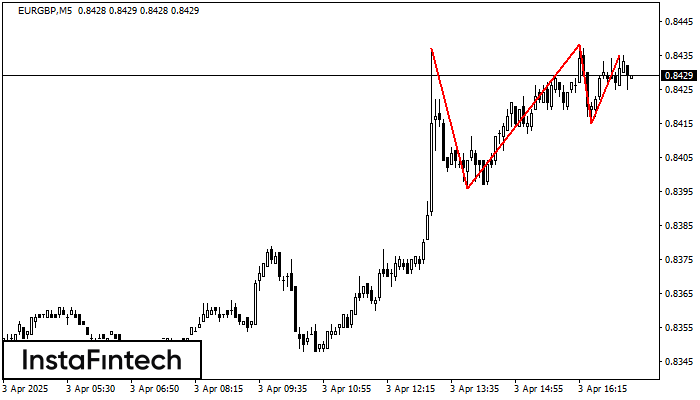
The Triple Top pattern has formed on the chart of the EURGBP M5. Features of the pattern: borders have an ascending angle; the lower line of the pattern has the coordinates 0.8396/0.8415 with the upper limit 0.8437/0.8435; the projection of the width is 41 points. The formation of the Triple Top figure most likely indicates a change in the trend from upward to downward. This means that in the event of a breakdown of the support level of 0.8396, the price is most likely to continue the downward movement.
The M5 and M15 time frames may have more false entry points.
انظر أيضا
- All
- All
- Bearish Rectangle
- Bearish Symmetrical Triangle
- Bearish Symmetrical Triangle
- Bullish Rectangle
- Double Top
- Double Top
- Triple Bottom
- Triple Bottom
- Triple Top
- Triple Top
- All
- All
- Buy
- Sale
- All
- 1
- 2
- 3
- 4
- 5
Cờ hiệu tăng
was formed on 13.04 at 11:56:52 (UTC+0)
signal strength 1 of 5

Tín hiệu Cờ hiệu tăng - Công cụ giao dịch #Bitcoin M5, mô hình tiếp tục. Dự đoán: có thể thiết lập vị trí mua trên
Khung thời gian M5 và M15 có thể có nhiều điểm vào lệnh sai hơn.
Open chart in a new window
Hình chữ nhật tăng
was formed on 11.04 at 22:20:31 (UTC+0)
signal strength 1 of 5

Theo biểu đồ của M5, NZDCHF đã tạo thành Hình chữ nhật tăng. Mô hình này cho thấy một sự tiếp tục xu hướng. Đường viền trên là 0.4754, đường
Khung thời gian M5 và M15 có thể có nhiều điểm vào lệnh sai hơn.
Open chart in a new window
Hình chữ nhật giảm
was formed on 11.04 at 22:10:27 (UTC+0)
signal strength 1 of 5

Theo biểu đồ của M5, USDCAD đã hình thành Hình chữ nhật giảm, cái mà là mô hình của sự tiếp tục xu hướng. Mô hình được chứa trong
Khung thời gian M5 và M15 có thể có nhiều điểm vào lệnh sai hơn.
Open chart in a new window