النماذج الفعلية

النماذج هي نماذج رسومية تتشكل في الرسم البياني حسب السعر. وفقا لأحد المسلمات التحليلية الفنية، فإن التاريخ (حركة السعر) يكرر نفسه. ويعني ذلك أن حركات الأسعار غالباً ما تكون متشابهة في نفس الأوضاع مما يجعل من الممكن التنبؤ بزيادة تطوير الوضع الذي يتسم باحتمال كبير.
النماذج ذات الصلة المقدمة من قبل إنستافوركس هي خدمة سهلة الاستخدام تسمح لك بمعرفة التغييرات الأخيرة في السوق والرد على الأدلة من السوق في الوقت المناسب. في خدمتنا، ستجد دائمًا النماذج الأكثر حداثة وملاءمة في أي زوج وأي إطار زمني.
Bullish Rectangle
was formed on 02.04 at 21:51:35 (UTC+0)
signal strength 1 of 5
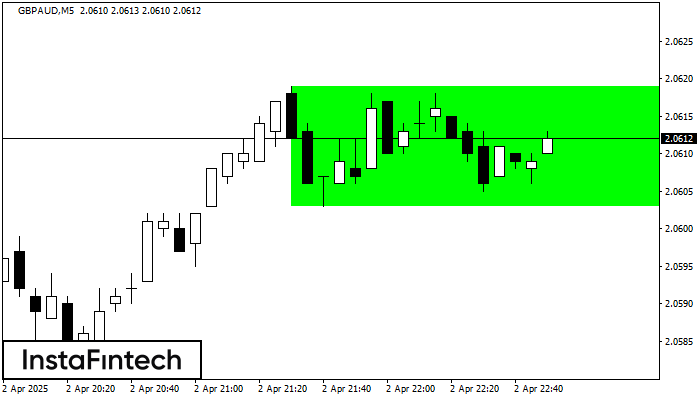
According to the chart of M5, GBPAUD formed the Bullish Rectangle which is a pattern of a trend continuation. The pattern is contained within the following borders: the lower border 2.0603 – 2.0603 and upper border 2.0619 – 2.0619. In case the upper border is broken, the instrument is likely to follow the upward trend.
The M5 and M15 time frames may have more false entry points.
- All
- All
- Bearish Rectangle
- Bearish Symmetrical Triangle
- Bearish Symmetrical Triangle
- Bullish Rectangle
- Double Top
- Double Top
- Triple Bottom
- Triple Bottom
- Triple Top
- Triple Top
- All
- All
- Buy
- Sale
- All
- 1
- 2
- 3
- 4
- 5
Triângulo Simétrico de Baixa
was formed on 24.04 at 10:20:21 (UTC+0)
signal strength 1 of 5

De acordo com o gráfico de M5, GOLD formou o padrão Triângulo Simétrico de Baixa. Descrição: o limite inferior é 3314.14/3331.45 e o limite superior é 3343.45/3331.45. A largura
Os intervalos M5 e M15 podem ter mais pontos de entrada falsos.
Open chart in a new window
Fundo triplo
was formed on 24.04 at 10:00:17 (UTC+0)
signal strength 4 of 5

O padrão Fundo triplo foi formado no gráfico de EURUSD H1. Características do padrão: A linha inferior do padrão tem coordenadas 1.1439 com o limite superior 1.1439/1.1357, a projeção
Open chart in a new window
Retângulo de alta
was formed on 24.04 at 09:19:04 (UTC+0)
signal strength 3 of 5
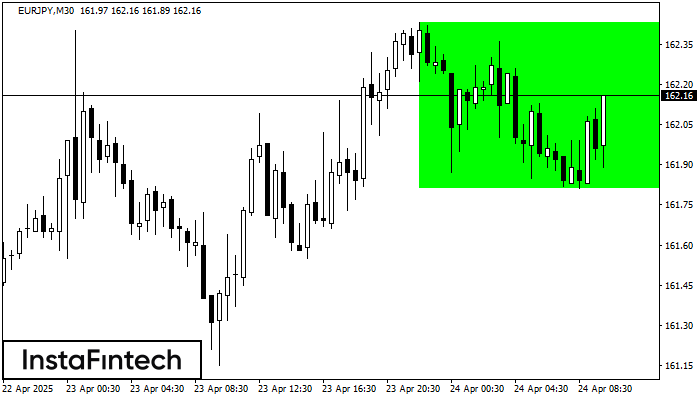
De acordo com o gráfico de M30, EURJPY formou Retângulo de alta. O padrão indica uma continuação da tendência. O limite superior é 162.43, o limite inferior é 161.81
Open chart in a new window