
 14.09.2022 07:29 PM
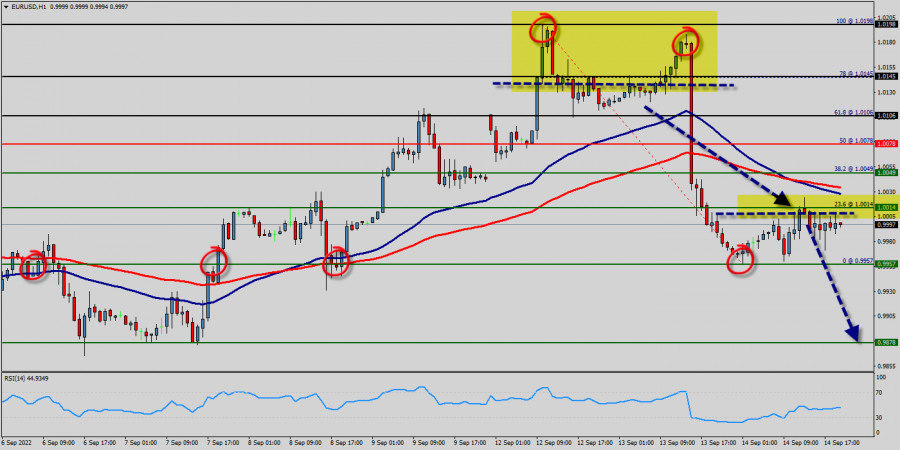
The EUR/USD pair stayed below the psychological level of 1.0078 over the week, indicating a lack of urgency to accumulate at the current levels. The bears are attempting to extend EUR/USD pair's decline below 0.9957 to bottomed at 1 USD right now.
The EUR/USD pair remains downside for consolidation below 1.0078 temporary low. Downside of recovery should be limited by 0.9957 support turned resistance to bring another fall.
The Euro pair depreciated further to 1 USD, the lowest level in this week, falling towards parity against the dollar on concerns the energy crisis would lead Europe's region to a deep recession, placing the ECB between a rock and a hard place as it tries to curb inflation and rest a slowing economy. The EUR/USD pair decreased within adown channel.
It then trimmed losses, dropping to 0.9957. The move lower took place amid a stronger US dollar across the board. Probably, the main scenario is continued decline towards 0.9800 (sentiment level). Some fundamental news will impact on the EUR/USD pair in coming days because The euro has a flexible exchange rate, which is dependent on three factors : The European Central Bank's benchmark interest rate. Additionally, the debt levels of individual countries within the EU. Moreover, the strength of the European economy.
Closing below the pivot point (1.0078) could assure that the EUR/USD pair will move lower towards cooling new lows. Then, the bears must break through the price of 1 USD n order to resume the downtrend.
The trend is still below the 100 EMA for that the bearish outlook remains the same as long as the 100 EMA is headed to the downside. Hence, the price spot of 1.0078 remains a significant resistance zone.
Also it should notice that the Euro is edging lower against the U.S. Dollar late in the session this morning in a volatile session that saw the single currency posting an early loss before continuing after data in the U.S. showed the world's largest economy created more jobs than expected this month.
Since the trend is below the 50% Fibonacci level (1.0078), the market is still in a downtrend. Overall, we still prefer the bearish scenario. Consequently, there is a possibility that the EUR/USD pair will move downside. The structure of a fall does not look corrective.
If the pair fails to pass through the level of 0.9957, the market will indicate a bearish opportunity below the strong resistance level of 1.0078.
The trend is still calling for a strong bearish market from the spot of 1.0078. Sellers are asking for a high price. In this regard, sell deals are recommended lower than the 1.0078 level with the first target at 0.9957.
It is possible that the pair will carry on downwards continuing the development of the bearish trend to the level 0.9878.
However, stop loss has always been in consideration thus it will be useful to set it above the last double top at the level of 1.0198 (notice that the major resistance today has set at 1.0198). Please check out the market volatility before investing, because the sight price may have already been reached and scenarios might have become invalidated.
You have already liked this post today
*The market analysis posted here is meant to increase your awareness, but not to give instructions to make a trade.
في وقت مبكر من الجلسة الأمريكية، كان الذهب يتداول عند حوالي 3,333 ضمن قناة الاتجاه الهابط التي تشكلت في 22 أبريل. يظهر زوج XAU/USD علامات على التشبع البيعي ويرتد
روابط مفيدة: مقالاتي الأخرى متوفرة في هذا القسم دورة InstaForex للمبتدئين التحليلات الشائعة افتح حساب تداول مهم: يجب على المبتدئين في تداول الفوركس أن يكونوا حذرين للغاية عند اتخاذ القرارات
إذا نظرنا إلى الرسم البياني لمدة 4 ساعات لزوج العملات المتقاطع GBP/CHF، نجد عدة حقائق مثيرة للاهتمام. أولاً، ظهور نمط المثلث متبوعًا بحركة المتوسط المتحرك الأسي (21) الذي يتحرك
مع حركة سعر زوج العملات المتقاطع AUD/CAD فوق المتوسط المتحرك الوزني (WMA) لفترة 21 والذي يميل إلى الصعود وظهور التقارب بين حركة سعر AUD/CAD ومؤشر المذبذب العشوائي، فإن ذلك يعطي
وصل مؤشر النسر إلى مستويات الشراء المفرط. ومع ذلك، يمكن أن يصل المعدن إلى الارتفاع حول 8/8 Murray، والذي يمثل حاجزًا قويًا للذهب. أسفل هذه المنطقة، قد تكون لدينا
حسابات بي إيه إم إم
في إنستافوركس

Your IP address shows that you are currently located in the USA. If you are a resident of the United States, you are prohibited from using the services of InstaFintech Group including online trading, online transfers, deposit/withdrawal of funds, etc.
If you think you are seeing this message by mistake and your location is not the US, kindly proceed to the website. Otherwise, you must leave the website in order to comply with government restrictions.
Why does your IP address show your location as the USA?
Please confirm whether you are a US resident or not by clicking the relevant button below. If you choose the wrong option, being a US resident, you will not be able to open an account with InstaTrade anyway.
We are sorry for any inconvenience caused by this message.

